May 2022 Water Quantity Produced
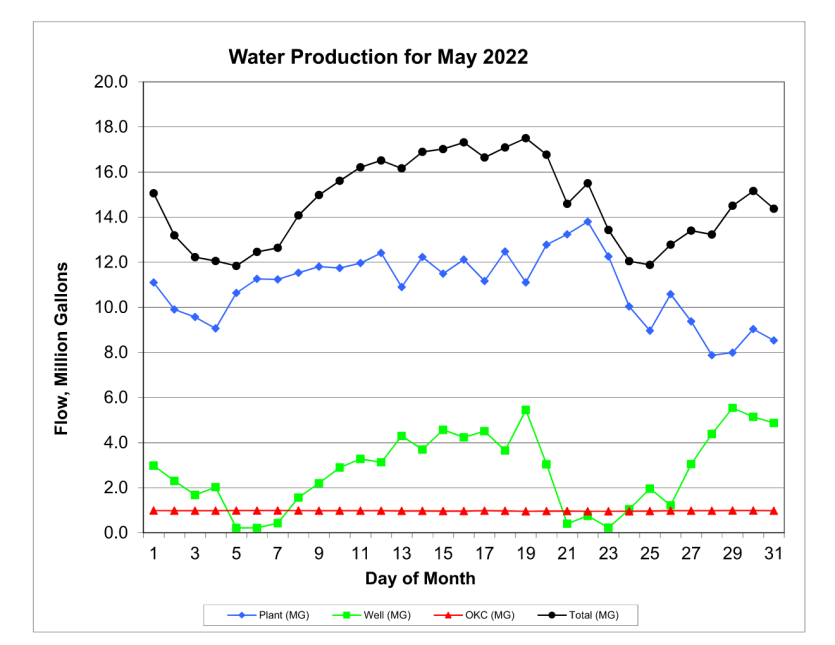 The graph shows contribution from Norman's water portfolio: Groundwater, OKC treated surface water and Norman treated surface water
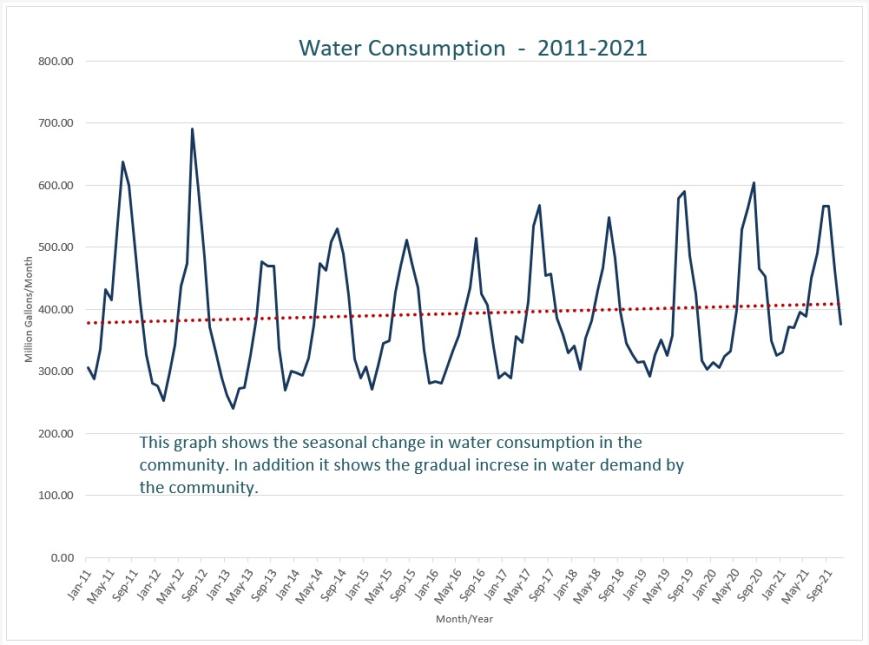 A look at 10 year of Water Consumption by the Norman community.
Groundwater Monitoring Well Graphics
Groundwater levels can be monitored and displayed on graphs. These graphs are from monitoring wells in East Norman. These wells monitor water level at shallow, medium and deep water levels in the aquifer. As you see the shaded areas on the graph identify when a City groundwater well at the site is running. The graph allows us to see the water level and the impact ground water production can have on aquifer level.
Mid depth monitor at well 42
Shallow depth monitor at well 42